Hello! By now you have seen Tandika's article explaining why it’s been so long since we have posted anything. It’s been a wild three years! Things are finally getting back to normal (although as she mentioned, a new normal.)
This post, as well as the next several “The Artist’s Husband” posts, were written three years ago, when I thought they’d be published. I’ll post these about once a week until I work through the backlog. After that, I plan to continue posting periodically, as often as I can.
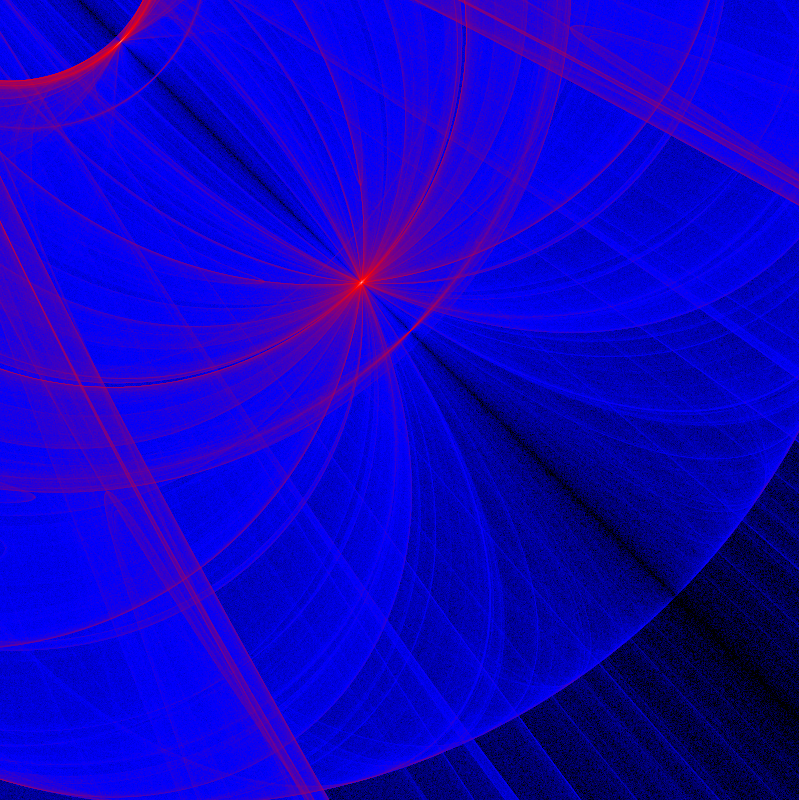
We’re making another stop on my journey towards colorizing a de Jong attractor image! This image is a portion of a much larger 6000x6000 image I generated. As you can see, there is quite a bit of detail in there!
So where does the color come from? You may recall from my last post that I am collecting counts of the number of times I see each point as I calculate repeatedly through the de Jong function system. I stop when any point reaches a value of 65535, then use the values for all the points to generate the image. Last week, I used the hit count for each point as a greyscale value for the corresponding pixel, producing a black & white image. This week, I am doing something a bit different: I specified two color ranges: black (#000000) to blue (#0000FF), and blue to red (#FF0000). Each point has a value between 0 and 65535. For each point, if it appears in the first half of that range (0-32767), I assigned it to the first color range. Otherwise, I assigned it to the 2nd color range.
Once assigned to a color range, I figured out the percentage of that point value within it’s value range. For example, a point with a value of 40000 is in the 32768 to 65535 range, so its percentage (40000 - 32768) / (65535 - 32768), or 22% of the way through the range. This is assigned to the 2nd color range. This color range goes from blue (red=0, green=0, blue=255) to red (red=255, green=0, blue=0). The green is 0 at both ends of the range, so it never changes, but red has to move from 0 to 255, and blue has to move from 255 to 0. For this point, we want to find the color that is 22% of that transition. So red would be 56, and blue would be 199, making the final color for that point #3800C7 (red=56, green=0, blue=199), a bluish purple. This calculation has to be done for every point that was calculated, which can take some time for large images, even on a fast computer!
But there are still problems. Have a look at the complete image:
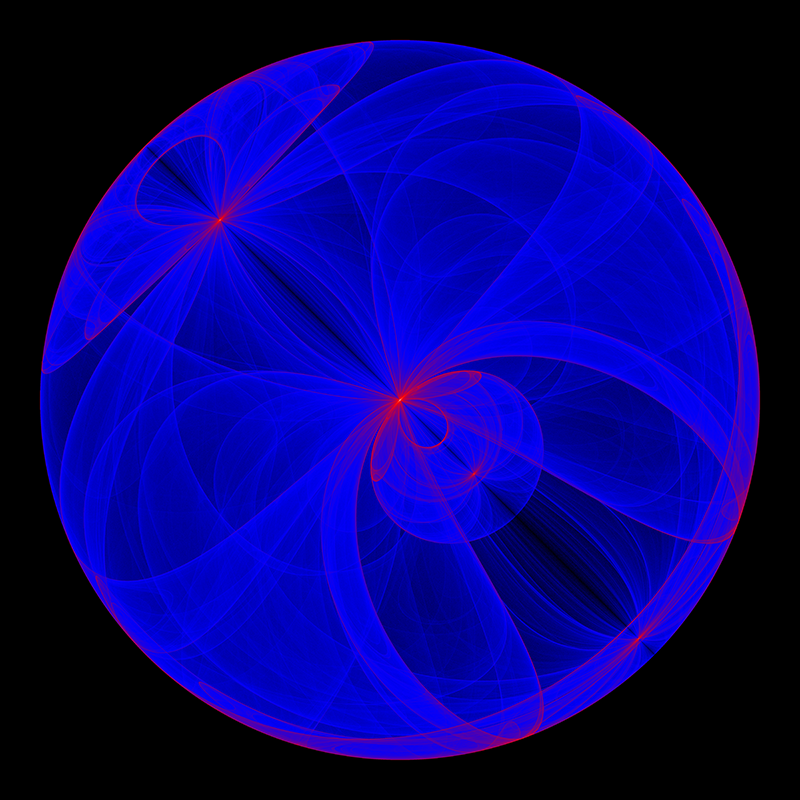
Notice that most of it is blue! There is comparatively very little red in the image. That’s because the points are not distributed evenly. There are far more points in the 0 - 32767 range than in the 32768 - 65535 range. Actually, it’s worse than it looks! Just to get it to come out like it did, I applied a logarithmic function to the points to try to spread out their values more. Without that, there is substantially less red in the image. Of course, another reason for more blue is that even in the 2nd color range, the points start with blue before progressing through purple and into red.
I’ll keep experimenting with this to try to find a general solution to coloring a de Jong image.