I am the Artist’s Husband. Yes, I really am Tandika’s husband, and no I am not really an artist. But I am interested in art!
I am a software engineer. Recently, I have been looking in to generative art , or art which is created through some automated means, and I thought I would share some of what I have learned as well as some of the results of my early experiments.
Generative art is not just writing a computer program to draw a picture, although some pretty impressive work can be done using that method. Fractals are an example of this way of generating an image. While the results are detailed and can be beautiful, the algorithm is deterministic – running the program again will generate the exact same image.
Generative art goes a step further by introducing some randomness into the process. The artist may decide what the finished work should look like and guides the overall process, but the exact details are not under his control. It’s like when Jackson Pollock was splattering paint on his canvases – he had substantial control over what the finished work looked like, but he had little control over where specific drops of paint ended up.
There are many ways to create generative art. I am using the Javascript programming language, with the p5.js drawing library. The p5.js library is a Javascript implementation of the ideas found in the Processing language, which has been used for years by digital artists. An advantage of the p5.js library is that a web browser can be used to build the image, making it relatively simple to do and easy to share with others.
Drunken Lines
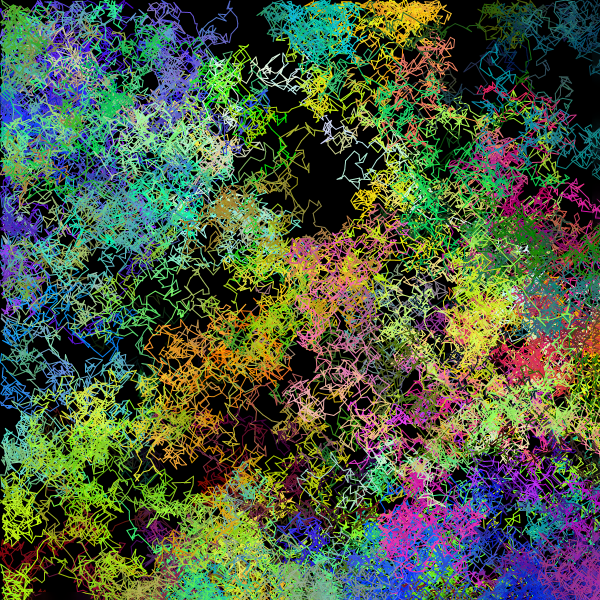
The image at the top of this post is called Drunken Lines. I call it that not so much because of what it looks like, but because of how it was generated. The basic idea is that a series of short lines is drawn, connected end to end. The exact length of each line and its direction is random, so the path that is created is much like what might be followed by a drunk person staggering around a room. The lines can’t go beyond the boundries of the “room”. I have added color by also randomizing the color of each line in such a way that the color of each line is not very different from the previous line, but that over time, the full range of colors can potentially appear.
I’ll explain the details of how I made this image. Beware! Computer programming and gratuitous Math beyond this point! At the end of this post, I’ll show you how you can try these ideas out yourself!
The Canvas
The first thing we need is a canvas to draw on. HTML 5 actually has a canvas element that is for this exact purpose, and p5.js makes heavy use of it.
To create an image using p5.js, you need to define two functions, one called setup() and one called draw().
The setup() function run once, so it is used to set up the work area.
The draw() function runs over and over again once the setup is complete, and is where the real work is done.
We only need to create the canvas once, so it is in the setup() function:
function setup() {
  createCanvas(600, 600);
  background(0);
}

function draw() {
}
This setup() function actually does two things.
First it creates a square canvas that is 100 pixels in width, and 100 pixels in height.
Second, it sets the background to black.
There is also a draw() function, but it does not do anything yet.
If you run this program, you will see just a small black square:

The Lines
Now we need to be able to draw a line.
Luckily, p5.js has a line() function!
Before we start drawing lines though, an understanding of the coordinate system would be helpful. In this example, our canvas is 100 pixels wide and 100 pixels tall. The first pixel in both cases is the 0 (zero) position. Note that this is 0, not 1! This means the last one, the hundredth one, will be referred to as 99, not 100. So any pixel on the canvas can be referred to with two numbers: how far from 0 it is in width (which we’ll call x), and how far it is from 0 it is in height (which we’ll call y).
So where is (0,0) on the canvas? Those of you who were paying attention in High School algebra may expect it to be the lower left corner. That is an excellent (but wrong) guess! It’s actually the upper left corner. So when you are placing anything on the canvas, you need to specify an x-value (how far from the left edge it is) and a y-value (how far down from the top it is.)
Let’s add a few lines to our canvas. We’ll draw a line from (10,10) to (20,20), one from (20,20) to (30, 10), and one from (30,20) to (40,10).
function setup() {
    createCanvas(100, 100);
    background(0);
    stroke(255, 255, 255);
}

function draw() {
    line(10, 10, 20, 20);
    line(20, 20, 30, 10);
    line(30, 20, 40, 10);
}
Notice that there is a new stroke() function call in the setup() function.
This tells the system to make any lines it draws from then on white.
I’ll explain in the color section below why that works.
It’s necessary to set this because the default color is black, which we could not see against our black background.
The draw() function now contains commands to draw three lines.
Each line() function call needs 4 numbers.
The first two are the x and y locations for the start of the line, and the last two are the x and y
locations for the end of the line.
So line(10, 10, 20, 20); draws a line from (10,10) to (20,20).
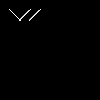
Here is the canvas with our three lines.
I mentioned earlier that setup() runs once, then draw() runs over and over again.
So although you don’t see any change in the canvas, what is really going on is that the same three lines
are being redrawn over and over again.
Before we go any further, I’d better mention how variables work, as we’ll be needing them to do anything fancier.
Variables are named locations for storing values. They help make you program more readable, and are essential for keeping track of values that change as the program is run.
For example, assuming we want a square canvas, we can define a single variable to be both width and height. The background color can also be assigned to a variable.
const canvasSize = 100;
const backgroundColor = 0;

function setup() {
    createCanvas(canvasSize, canvasSize);
    background(backgroundColor);
    stroke(255, 255, 255);
}

function draw() {
    line(10, 10, 20, 20);
    line(20, 20, 30, 10);
    line(30, 20, 40, 10);
}
Since these are assigned only once and never change, they technically aren’t variables at all, but are constants.
So they are identified with the const keyword.
A big advantage of using constants like this is that if you want to change one, for example make the canvas size 200
instead of 100, there is only one place you have to change it.
Currently, canvasSize only appears in two places in the program after it is defines, and both of those are on the
same line, so it seems like you aren’t saving much, but that will change rapidly, even in our simple example.
We want to draw a series of connected lines, so we need x and y variables to keep track of where we are.
Let’s define those variables and set their initial values to the center of the canvas.
These will eventually be changed as the program runs, so we’ll define them using the let keyword.
In addition, we’ll modify our three lines so the all start at the center of the canvas.
const canvasSize = 100;
const backgroundColor = 0;

let x = canvasSize/2;
let y = canvasSize/2;

function setup() {
    createCanvas(canvasSize, canvasSize);
    background(backgroundColor);
    stroke(255, 255, 255);
}

function draw() {
    line(x, y, 20, 20);
    line(x, y, 50, 20);
    line(x, y, 80, 20);
}
Both x and y are set to canvasSize/2.
Since canvasSize was set to 100 earlier, this ends up being 50, which is about as close to the center of the canvas
as we can get.
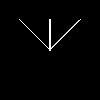
Now our canvas looks like this:
So how do we draw several random lines connected together?
Remember that the draw() function doesn’t run only once, it runs over and over.
The trick is to have it change some of the variables so that the draw() function does
something different next time it runs.
At the beginning of the program, the (x,y) point is (50,50).
We need the draw() function to draw a line, and set x and y to where the line ended, so the next line will start
from there. We also need to figure out how to draw that random line.
As for the random line, we know where it starts: (x,y),
we just need a random new point to draw to, which we’ll call (x1,y1).
There is a random() function that can generatex1 and y1 for us.
We need to pass it two numbers, a lower number and a higher number, and it will return a number that is greater than
or equal to the lower number, and less than the higher number.
Note that it can never be equal to the higher number!
So let’s assume we want short lines. We don’t want x or y to change by more than 5 pixels at a time.
We can use random() to generate the amount of change: change = Math.floor(random(-5, 6));.
The extra bit with the floor() function is necessary because random() returns a floating point number
(it could be something like 3.96), whereas we only want integers.
The floor() function drops anything to the right of the decimal point.
Because we gave 6 as the high end, and random() will never give us 6 (although it could give use 5.999999),
the highest integer we can get is 5, while the lowest is -5.
We can add this to the old value to get the new value.
Let’s modify our program to continually draw random connected lines:
const canvasSize = 100;
const backgroundColor = 0;
const positionIncrement = 5;

let x = canvasSize/2;
let y = canvasSize/2;

function setup() {
    createCanvas(canvasSize, canvasSize);
    background(backgroundColor);
    stroke(255, 255, 255);
}

function draw() {
    let x1 = x + Math.floor(random(-positionIncrement, positionIncrement+1));
    let y1 = y + Math.floor(random(-positionIncrement, positionIncrement+1));
    line(x, y, x1, y1);
    x = x1;
    y = y1
}
We have defined a positionIncrement constant, and we use it come up with x1 and y1.
Then we draw a line from (x,y) to (x1,y1).
Lastly, we set x and y to the new x1 and y1 values so we can
use the end of the line as the beginning of the next.
Now our canvas looks like this:
Note: because of the random() function, it won’t really look exactly like this!
It will be different every time you run it.
If you run this, you’ll notice that it line being drawn eventually wanders off the screen and doesn’t come back. That’s because there is nothing requiring the line to stay on the canvas. We can get around that by writing a new function that receives the starting value, the increment, and minimum and maximum acceptable results, and have that function do the work of tossing the value back into the allowable range if it wanders off.
const canvasSize = 100;
const backgroundColor = 0;
const positionIncrement = 5;

let x = canvasSize/2;
let y = canvasSize/2;

function setup() {
    createCanvas(canvasSize, canvasSize);
    background(backgroundColor);
    stroke(255, 255, 255);
}

function draw() {
    let x1 = randomChange(x, positionIncrement, 0, canvasSize-1);
    let y1 = randomChange(y, positionIncrement, 0, canvasSize-1);
    line(x, y, x1, y1);
    x = x1;
    y = y1
}

function randomChange(original, increment, min, max) {
    let v = original + Math.floor(random(-increment, increment+1));
    if (v < min) {
        v = v + increment;
    }
    if (v > max) {
        v = v - increment;
    }

    return v;
}
Now the line stays inside the box.
The Colors
“That’s all well and fine”, I hear you saying, “but what about the colors?”
First we need to talk a little bit about how colors work on a web page. Any color is defined as a mixture of red, green and blue, which of course takes three numbers to define. Each of those three colors can be a number between 0 and 255. So (255,0,0) is bright red, (0,0,255) is bright blue, (0,0,0) is black, and (255,255,255) is bright white.
Remember earlier when we added stroke(255, 255, 255); to the setup() function to make the line white?
Now you know how to set it to any color you want!
We can modify the color the same way we modify the position.
We can even use the same randomChange() function to do it!
We just decide on an amount we want it to change, and then make sure we don’t go less than 0 or more than 255.
Here is the final version of the program:
const canvasSize = 600;
const backgroundColor = 0;
const positionIncrement = 10;
const colorIncrement = 5;

let x = canvasSize/2;
let y = canvasSize/2;
let red = 128;
let green = 128;
let blue = 128;

function setup() {
    createCanvas(canvasSize, canvasSize);
    background(backgroundColor);
    stroke(red, green, blue);
}

function draw() {
    let x1 = randomChange(x, positionIncrement, 0, canvasSize-1);
    let y1 = randomChange(y, positionIncrement, 0, canvasSize-1);
    line(x, y, x1, y1);
    x = x1;
    y = y1

    red = randomChange(red, colorIncrement, 0, 255);
    green = randomChange(green, colorIncrement, 0, 255);
    blue = randomChange(blue, colorIncrement, 0, 255);
    stroke(red, green, blue);
}

function randomChange(original, increment, min, max) {
    let v = original + Math.floor(random(-increment, increment+1));
    if (v < min) {
        v = v + increment;
    }
    if (v > max) {
        v = v - increment;
    }

    return v;
}
There are variables for red, green and blue, and they all start out set to 128,
which will provide a medium grey color to start with.
After we draw each line, we change the red, green and blue values slightly,
and rerun the stroke() function to set up the new color.
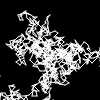
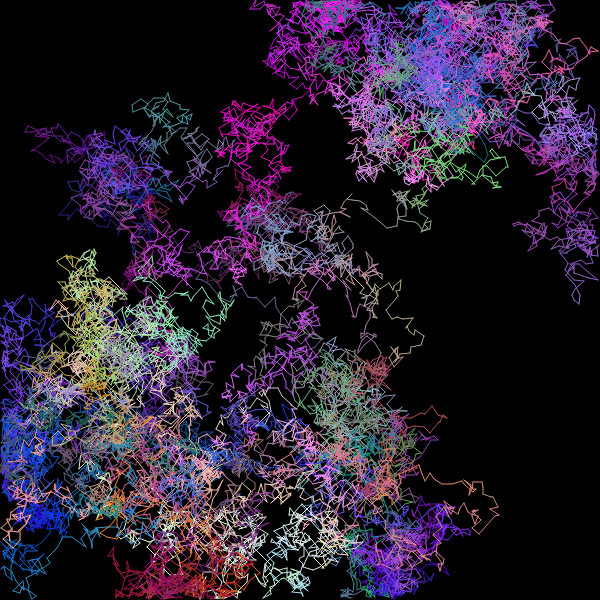
For this example, I have set the canvas and the increments slightly larger. These are values used to generate the image at the top of this post. Here is another example using these settings:
As it stands, the program runs forever, constantly writing new lines to the image. How long you let it run has a significant impact on how it looks.
Learning More
This was a fairly simple example. If it has whet your appetite to learn more, check out the p5.js documentation. There is an online editor you can use to try things out. You can copy the example programs from this post there, and they should work fine. There are a great many other examples to look at as well.
For more information about generative art, check out this article on Artnome .
Have fun with it!