Any Zentanglers out there who made it through my previous posts on generative art may be wondering whether these techniques can be used to draw Zentangles . Let’s try!
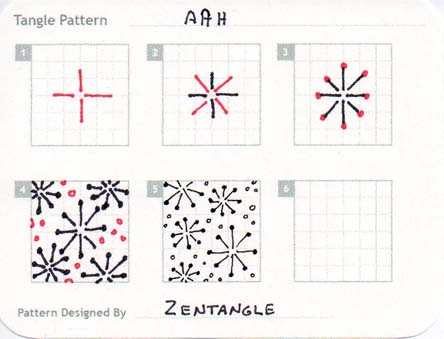
Zentangles are built from patterns, called tangles. We’ll try to create a tangle called aah. This is one of the original tangles from the
Zentangle originators
. There are many variations of aah. We’ll start with a simple 8-armed design. Tandika’s step-out for it looks like this:
There are some
examples
on this site which use aah.
Technically, aah is the name of the pattern created by filling in an area as shown in figure 5 of the step-out. But I will risk the
CZTs
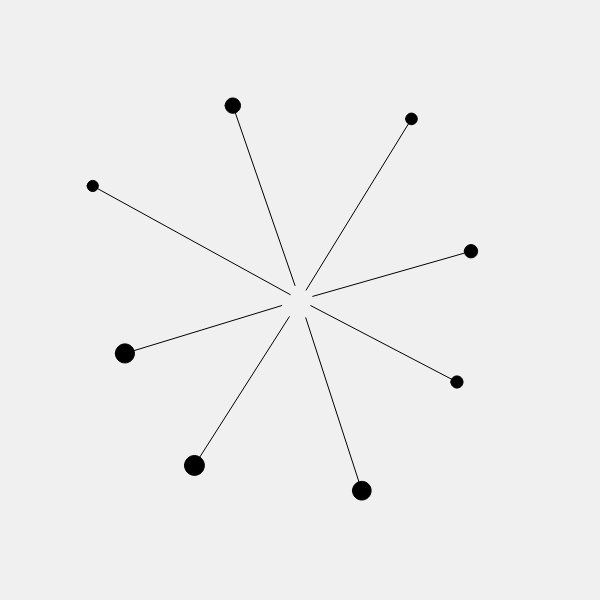
laughing at me by referring to a single 8-armed star as an aah. Today, we’ll look at a program to generate a single aah, like the one in figure 3 of the step-out. In a later post, we’ll try to cover an area with them.
As you can see, a single aah is a series of 8 lines of equal length, 45 degrees apart, with a dot on the end of each line. The lines all originate from the same center point, but they don’t actually touch it – there is a gap between the center and the start of each line. Drawing this is relatively simple, but we don’t want it to be completely regular. Because we are simulating a hand-drawn object, there should be some variations in the length of each line, how far from the center it starts, how big the dot on the end of the line is, how close each line is to 45 degrees from the previous, and how much the shape is rotated in the image.
Here is a javascript program that generates images like the one at the top of this post. As in my previous posts, we are using the p5.js art library.
const height = 600;
const width = 600;
const sizeAah = 400;    // Approximate size of each AAH

function setup() {
    createCanvas(width, height);
    background(240);
}

function draw() {
    const aah = newAah(sizeAah, [width/2, height/2]);
    drawAah(aah);
    noLoop();
}

function toCartesian(r, theta, [x, y]) {
    angleMode(DEGREES);
    p = [r * cos(theta), r * sin(theta)];
    if (x != undefined) p[0] += x;
    if (y != undefined) p[1] += y;

    return p
}

function newAah(size, [x, y]) {
    if (x === undefined) x = 0;
    if (y === undefined) y = 0;
    if (size === undefined) size = 100;

    let aah = {
        length: size/2, // Expected length of each arm in pixels
        lengthSD: 0,    // Standard deviation of arm length
        thetaSD: 2,     // Standard deviation of arm angle
        arms: [],       // Array of arms
    };

    aah.lengthSD = (0.05 + 0.05 * random()) * aah.length;

    const rotation = random(0, 45);
    for (let angle=0; angle<360; angle+=45) {
        const theta = randomGaussian(angle+rotation, aah.thetaSD);
        const r = randomGaussian(aah.length, aah.lengthSD);
        const gap = (0.05 + 0.05 * random()) * aah.length;
        let arm = {
            start: [],          // Draw line from here...
            stop: [],           // ...to here
            tipDiameter: gap,   // The tip diameter is the same as the gap for each line
        };
        arm.start = toCartesian(gap, theta, [x, y]);
        arm.stop = toCartesian(r, theta, [x, y]);
        aah.arms.push(arm);
    }

    return aah;
}

function drawAah(aah) {
    fill(0, 0, 0);
    stroke(0, 0, 0);
    aah.arms.forEach(arm => {
        line(arm.start[0], arm.start[1], arm.stop[0], arm.stop[1]);
        circle(arm.stop[0], arm.stop[1], arm.tipDiameter);
    });
}
There is a lot going on here, but don’t worry, it’s not hard. Before we look at the code in detail, there are two concepts to understand: how the coordinate system works, and how the points are represented in the code.
As I’ve mention is previous posts, coordinates describing each point consist of an (x,y) value, measured from the upper left corner of your canvas. So the upper left corner is (0,0), and any other point on the canvas can be described by how far to the right it is (x) and how for down from the top it is (y). This is called the cartesian coordinate system, and it is excellent for describing points laid out on a grid. But this isn’t the only possible coordinate system! There is also the polar coordinate system. Polar coordinates also start at (0,0) in the upper left, and also have two values. With polar coordinates, the values are (r, θ). The second value is the greek letter, theta. r is the distance the point is from (0,0), and theta is the angle from (0,0). Polar coordinates are excellent for describing object laid out in a circle. Because a single aah is roughly circular, it’s much more convenient to describe and manipulate it with polar coordinates. In our program, we use polar coordinates to describe the aah, and convert them to cartesian coordinates to draw them.
The 2nd thing to understand is how the cartesian points are represented in the code. Each point has two values, x and y, and there are several ways to represent them. They could just be represented by two variables, but that gets unwieldy when you have more than one point (if you call the first set of variables x and y, what do you call the second set?). In this program, we represent cartesian points with an array with two elements. The first element, element 0, is x, and the second, element 1, is y. So if you have a point named p, p[0] is x, and p[1] is y. You’ll see this convention used all throughout the program above.
The cartesian and polar coordinate systems are different, but both can define any point on a canvas. So of course, it’s possible to convert one to the other. In our program, we have a function to convert (r, θ) to (x,y):
function toCartesian(r, theta, [x, y]) {
    angleMode(DEGREES);
    p = [r * cos(theta), r * sin(theta)];
    if (x != undefined) p[0] += x;
    if (y != undefined) p[1] += y;

    return p
}
This function receives r, the distance of the point from (0,0) and theta, the angle to the point from (0,0) and converts it to a cartesian point called p, which is an array of two elements, the x and y coordinates of the point. It also can receive an optional third parameter, another cartesian point. If this parameter exists, these values will be added to p. This is useful, because r and theta are measuring from the upper right corner of the canvas. Passing in the extra point effectively causes that point to be used as the origin instead of (0,0). This lets us draw from any point on the canvas using polar coordinates.
Most of the interesting stuff is going on in the newAah() function. This is where a new aah is created.
function newAah(size, [x, y]) {
    if (x === undefined) x = 0;
    if (y === undefined) y = 0;
    if (size === undefined) size = 100;

    let aah = {
        length: size/2, // Expected length of each arm in pixels
        lengthSD: 0,    // Standard deviation of arm length
        thetaSD: 2,     // Standard deviation of arm angle
        arms: [],       // Array of arms
    };

    aah.lengthSD = (0.05 + 0.05 * random()) * aah.length;

    const rotation = random(0, 45);
    for (let angle=0; angle<360; angle+=45) {
        const theta = randomGaussian(angle+rotation, aah.thetaSD);
        const r = randomGaussian(aah.length, aah.lengthSD);
        const gap = (0.05 + 0.05 * random()) * aah.length;
        let arm = {
            start: [],          // Draw line from here...
            stop: [],           // ...to here
            tipDiameter: gap,   // The tip diameter is the same as the gap for each line
        };
        arm.start = toCartesian(gap, theta, [x, y]);
        arm.stop = toCartesian(r, theta, [x, y]);
        aah.arms.push(arm);
    }

    return aah;
}
This function accepts two parameters: a size, and a point on the canvas where the aah should be drawn. Actually, both of these are optional – if no size is specified, it will default to 100 pixels, and if no point is specified, it defaults to (0,0). The point specifies the center of the aah.
First, we create a data structure called aah. This structure has four components.
length– The length of an arm of theaah. It is 1/2 ofsize.lengthSD– The standard deviation of the length. This will be used to vary the size of each of the arms slightly. We set this to zero to start with, but we’ll set it to a better value later.thetaSD– The standard deviation of the arm angle. This is used to vary the actual angle of each arm slightly.arms– An array of generated arms. At this point, this array is empty.
We set lengthSD to a random value that is between 5-10% of the value of length.
Before entering the loop to generate the arms, we choose a value for rotation that is a number of degrees between 0 and 45. Later, we’ll add this value to angle that we generate.
Next we enter a loop in which we start a variable called angle at 0, increasing it by 45 each time through the loop until it is greater than 360. So we will go through the loop 8 times, with angle set successively to 0, 45, 90, 135, 180, 225, 270, and 315.
Each time we go through the loop, we’ll generate an arm for the aah and add it to the arms array. Inside the loop, before we generate the arm, we want to add some variation to the angle and length. So we’ll create a theta variable that is the angle for this arm plus the rotation we calculated earlier, and randomize it using the thetaSD standard deviation, which will usually produce a variation of a few degrees at most. Then we’ll create an r variable that is the length varied using the lengthSD standard deviation. Lastly, we’ll generate a value for the gap, which is how far from the center the line should start. We are setting this to a random value between 5-10% of the length.
Now we are ready to generate the arm data structure, which has three elements:
start– The cartesian point where the line should start.stop– The cartesian point where the line should stop.tipDiameter– The diameter of the dot at the end of the line. For simplicity, we set this to be the same as the gap, but there is no reason it has to be.
Since we know the angle and distance we want to draw our line, we use the toCartesian() function to convert these to (x,y) for the start and stop locations for each line. The start coordinates are gap pixels from the center, and the stop coordinates are r pixels from the center.
The last thing we do in our loop is add that arm to the arms list.
The values used in this function as random ranges and standard deviations were chosen to give results similar to aah patterns I have seen in various zentangles. They could easily be changed to provide more or less variation. Season to taste.
The newAah() function does not draw the aah; that is left to the drawAah() function:
function drawAah(aah) {
    fill(0, 0, 0);
    stroke(0, 0, 0);
    aah.arms.forEach(arm => {
        line(arm.start[0], arm.start[1], arm.stop[0], arm.stop[1]);
        circle(arm.stop[0], arm.stop[1], arm.tipDiameter);
    });
}
There is not a lot going on in drawAah(). We just set the colors to black, then loop through the arms list, drawing each one. Each arm is just a line from start to stop and a circle right at the stop coordinates.
The rest of the program is just the setup() and draw() function you have seen before:
const height = 600;
const width = 600;
const sizeAah = 400;    // Approximate size of each AAH

function setup() {
    createCanvas(width, height);
    background(240);
}

function draw() {
    const aah = newAah(sizeAah, [width/2, height/2]);
    drawAah(aah);
    noLoop();
}
We are drawing on a 600x600 pixel canvas, and we want to draw a aah of about 400 pixels. The setup() function creates the canvas, and sets the background color. The draw() function creates one aah of the size we want, centered on the canvas, then it draws it.
That’s it! Now you know exactly how the image at the top of this post was generated. There is quite a bit that can be done to improve this. The various standard deviations and random values could be created outside the program and passed in for greater flexibility. The number of arms could be set through a variable, or could also be randomized. The dots could be placed somewhere other than at the end of each arm. We could even add color!
In my next post, I’ll show how to fill an area with aah images, creating the aah tangle.
If you’d like to learn more about Zentangles, check out their official site . For more information about polar coordinates, see Varun Vachhar's excellent explanation .