“Everybody should learn to program a computer, because it teaches you how to think.”
— Steve Jobs
I’ve shown many attractor images I have generated over the past few weeks, but how have I been drawing them? I have been writing code to do so, but stopped including it in the posts because it was getting long and complex. I promised that, someday, I would share the code. Today is that day!
Previously, I had been talking about using Clojure for drawing. However, for most of these images, I wrote the code in Java. The code can be found on GitLab . This code is not polished up for public consumption, but should be quite usable.
There is not separate code for each image. This is a general purpose program that can be used to generate de Jong and Svensson attractors. Adding support for other attractors would be easy – just a matter of extending the IFS class to support the new algorithm The DeJong and Svensson classes are examples of how this is done. Here is the Svensson class:
package com.xecko.attr;

public class Svensson extends IFS {

    private double a;
    private double b;
    private double c;
    private double d;

    Svensson(double a, double b, double c, double d) {
        this.a = a;
        this.b = b;
        this.c = c;
        this.d = d;

        // Random starting point
        x = (Math.random() * 4) - 2;
        y = (Math.random() * 4) - 2;
    }

    public double[] getCurrent() {
        return new double[] { x, y };
    }

    public double[] getNext() {
        double[] point = new double[2];

        point[0] = d * Math.sin(a * x) - Math.sin(b * y);
        point[1] = c * Math.cos(a * x) + Math.cos(b * y);
        x = point[0];
        y = point[1];

        return point;
    }

    public double[] getConstants() {
        return new double[] { a, b, c, d };
    }

    // Get absoute value of max range
    public double getMaxRange() {
        return Math.max(Math.abs(d), Math.abs(c)) + 1;
    }

    public void summarize() {
        System.out.printf("Svensson Constants:\n");
        System.out.printf("  a = %8.5f\n", a);
        System.out.printf("  b = %8.5f\n", b);
        System.out.printf("  c = %8.5f\n", c);
        System.out.printf("  d = %8.5f\n", d);
    }
}
Pay particular attention to the getNext() method, as that is where the algorithm is implemented. Also important is getMaxRange(), which should return that maximum absolute value of x or y that the algorithm can return. For the DeJong class, this is always 2.0. For Svensson, it depend on the vales of the c and d constants. This method is used by the
Canvas
to scale the image properly.
The program is compiled with the command mvn package. You will need both Maven and Java installed, of course. This was written on a Mac, but I would expect it to run under Windows as well, although I haven’t tested that. Once it is compiled, there is a helper command attr which can be used to run the program on a Mac. That won’t work on Windows, but you can look inside the attr file to see that command that is really being run.
This is a command-line program, and it can be complex to use. There is a single internal command (so far) called generate. To see how to use it, run ./attr generate -h:
$  ./attr generate -h
Usage: attractor generate [-hrvV] [--ra] [--rb] [--rc] [--rd] [-a=<a>] [-b=<b>]
                          [-c=<c>] [--cs=<colorScheme>] [-d=<d>]
                          [-f=<scaleFactor>] [-g=<algorithmType>]
                          [-o=<outputFile>] [--od=<outputDirectory>]
                          [-s=<size>] [-t=<threshold>] [--color=<colors>]...
Generate attractor images.
  -a=<a>                    The 'a' constant. How it is used depends on the
                              algorithm chosen. Default: -2.0.
  -b=<b>                    The 'b' constant. How it is used depends on the
                              algorithm chosen. Default: -2.0.
  -c=<c>                    The 'c' constant. How it is used depends on the
                              algorithm chosen. Default: -2.0.
      --color=<colors>      Color ranges. Example: #12439F-#FF456E:10. If the
                              first color is omitted, the end of the most
                              recently specified range is used. The number
                              after the colon is optional and is the percentage
                              if the full range to use these colors.
                              Percentages will be adjusted if they don't add up
                              to 100%. --color may appear multiple times, and
                              color ranges are used in order the appear on the
                              command line.
      --cs, --color-scheme=<colorScheme>
                            The scheme used to color the image. Only useful if
                              --color is also used. Possible values: frequency,
                              velocity. Default: 'frequency'.
  -d=<d>                    The 'd' constant. How it is used depends on the
                              algorithm chosen. Default: -2.0.
  -f, --scale-factor=<scaleFactor>
                            The percentage of the image used for the image. If
                              set to 100, the image will have no border.
                              Default: 90.
  -g, --algorithm=<algorithmType>
                            The algorithm used to generate the points. Possible
                              values: dejong, svensson. Default: dejong.
  -h, --help                Show this help message and exit.
  -o, --output-file=<outputFile>
                            The base name of the output file, without an
                              extension.
      --od, --output-dir=<outputDirectory>
                            The directory in which to place the output.
                              Default: '.'.
  -r, --randomize-constants Randomize all four constants. Default: false.
      --ra, --randomize-a   Randomize the 'a' constant. Default: false.
      --rb, --randomize-b   Randomize the 'b' constant. Default: false.
      --rc, --randomize-c   Randomize the 'c' constant. Default: false.
      --rd, --randomize-d   Randomize the 'd' constant. Default: false.
  -s, --size=<size>         Size in pixels, used for both width and height of
                              image. Default: 800.
  -t, --threshold=<threshold>
                            Stop processing when any pixel has been generated
                              this many times. Default: 65535.
  -v, --verbose             If set, print a summary of the work accomplished.
  -V, --version             Print version information and exit.
Here are some examples:
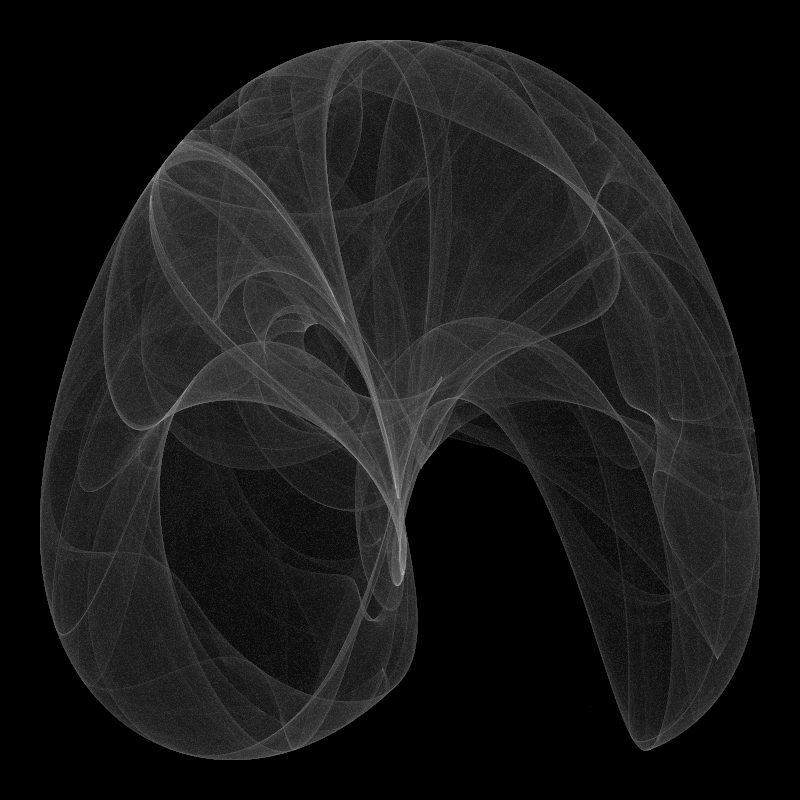
Generate a greyscale de Jong image with specific constants. If not specified, the algorithm is dejong, the output file is test.png in the current directory, and the size of the image is 800x800.
$ ./attr generate -a=1.4 -b=-2.3 -c=2.4 -d=-2.1
Adding color can be complicated. You can specify colors in web color format with the --color option. Use more than one to get multiple color ranges. For example to add three color ranges to the previous image, we could do this:
$ ./attr generate -a=1.4 -b=-2.3 -c=2.4 -d=-2.1 --color=#0000FF --color=#FF0000 --color=#00FF00
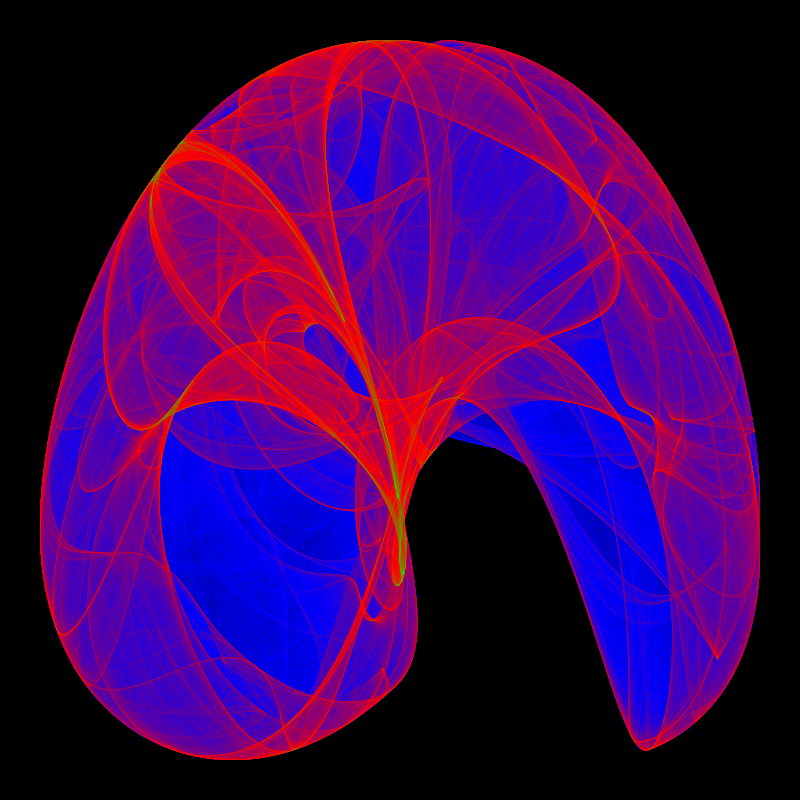
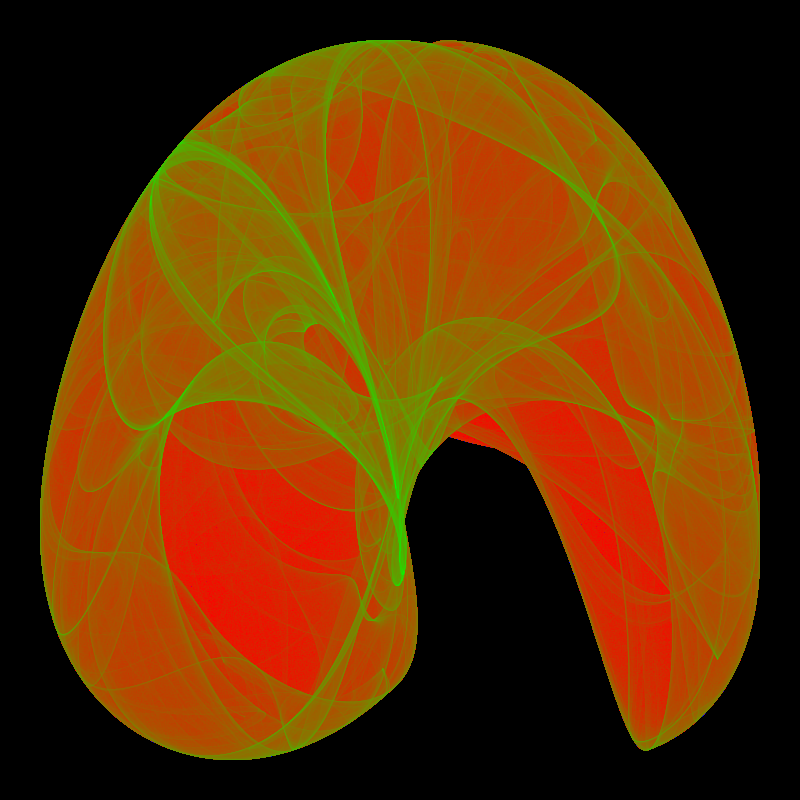
This colors the image based on the frequency of each point — the number of times the algorithm generated that point. As there are three colors, each range gets 33% of the frequency values. As I talked about in a previous post , the point frequencies are not evenly distributed, so you see a lot of blue and red, but almost no green. You can narrow down the ranges a bit by specifying a percentage each range should occupy:
$ ./attr generate -a=1.4 -b=-2.3 -c=2.4 -d=-2.1 --color=#0000FF:10 --color=#FF0000:10 --color=#00FF00:80
But now we have lost the blue! We can add more ranges as necessary. Just keep adjusting until you get something you like! Here I have added several color ranges, with ranges of black between the other colors. This brings out quite a bit of detail.
$ ./attr generate -a=1.4 -b=-2.3 -c=2.4 -d=-2.1 --color=#0000FF:1 --color=#000000:5 --color=#0000FF --color=#000000:5 --color=#FF0000:10 --color=#000000:5 --color=#00FF00:30 --color=#000000:5 --color=#FFFFFF
We’ll leave this image at that, since the point of this post is to talk about the software, not to fine-tune a particular image. I should explain that each of those --color entries is a range of colors, not just the one specified. The range starts from the last color specified, or from black if there is no previous color. You have control over the specific colors in the range. This command is exactly the same as the previous command, except that all the colors are listed instead of relying on the defaults:
$ ./attr generate -a=1.4 -b=-2.3 -c=2.4 -d=-2.1 --color=#000000-#0000FF:1 --color=#0000FF-#000000:5 --color=#000000-#0000FF --color=#0000FF-#000000:5 --color=#000000-#FF0000:10 --color=#FF0000-#000000:5 --color=#000000-#00FF00:30 --color=#00FF00-#000000:5 --color=#000000-#FFFFFF
The reason for defaulting to the previous color for the start of the current range is so that there is a smooth transition throughout the image. If you like, you can use color ranges unrelated to the previous range, but you’ll get some odd-looking results.
Now, what about those percentages? You probably noticed in the previous commands that 1) not all color ranges have a percentage, and 2) the percentages that are there don’t add up to 100%. If there is no percentage listed, then that range gets a percentage based on the number of ranges. There are nine ranges, so the default is 11%. That still doesn’t add up to 100%! Don’t worry, if the percentages specified are less (or more) than 100%, they get proportionally adjusted so that they end up totalling 100%. So they’re really just hints to the software how you’d like things to go…
Another option related to coloring is --color-scheme. This defaults to frequency, but if you’d rather color by
velocity
, then --color-scheme=velocity will do the trick.
An extremely important option is --algorithm, which chooses the system of equations to use to generate points. The default is dejong, but it could also be set to svensson.
There are a number of options to set the constants to specific values or randomize them. There are two things to keep in mind of you randomize values. First, you might have a gerenate a very boring image. If that happens, just try again. Second, always use the --verbose option, as this will display the values that were chosen. Otherwise, you will have no way of generating the image again if you find one you like!
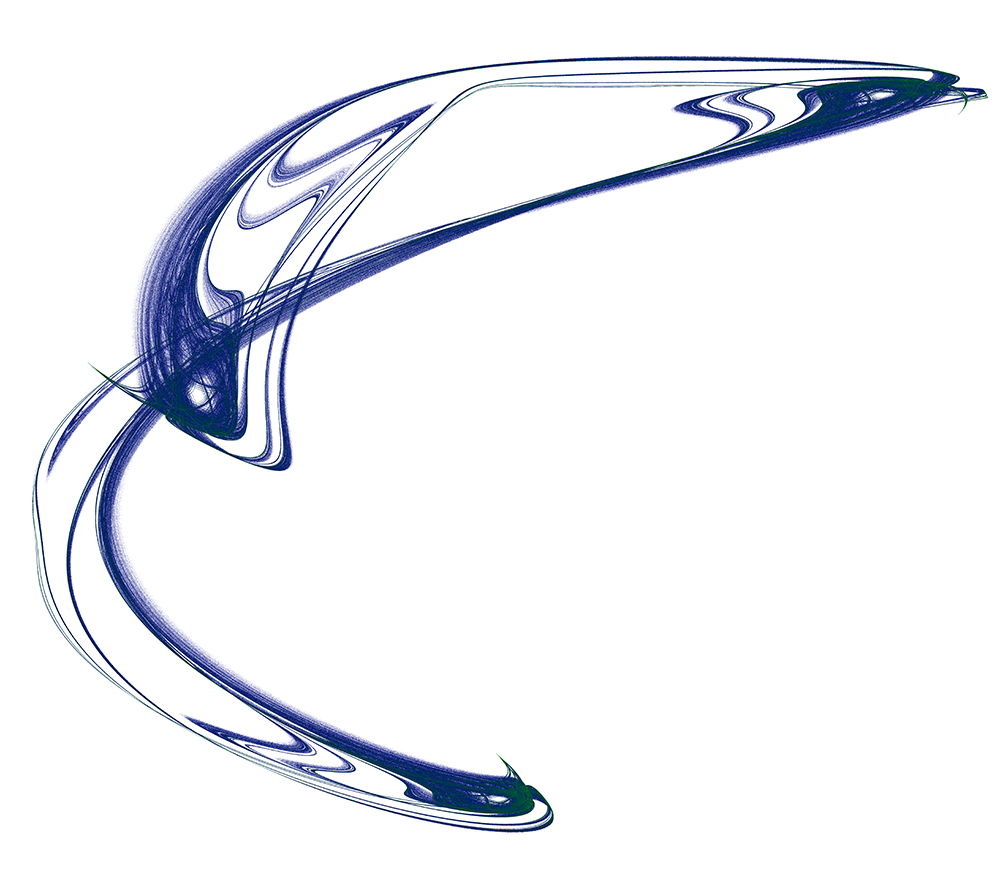
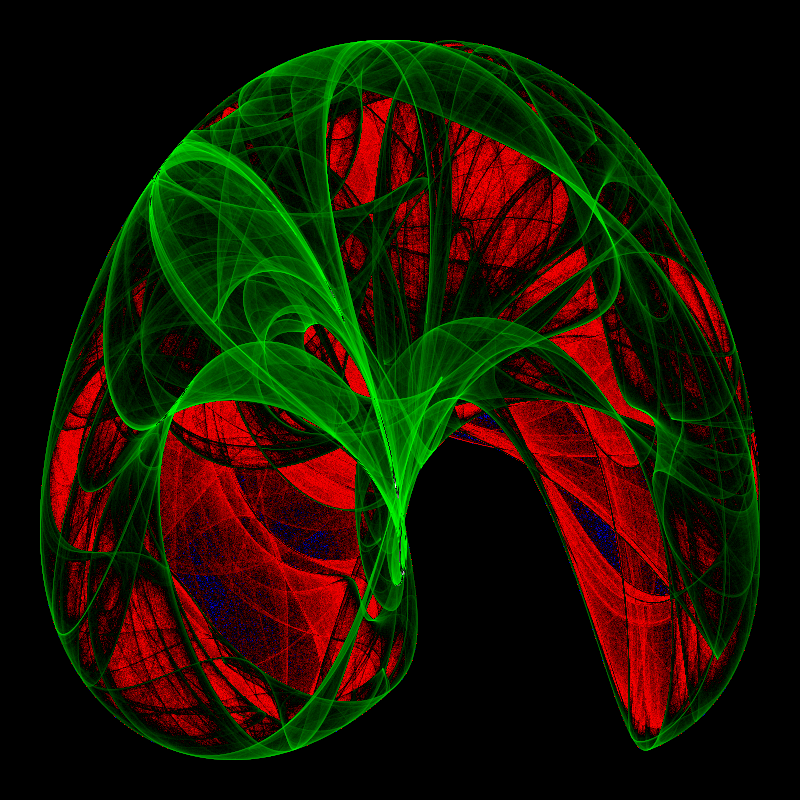
The image at the top of this post, rather unimaginatively named “Swoosh!”, is one of the ones I discovered running this program with random values. It was generated with this command:
$ ./attr generate -v -a=-2.77021 -b=-1.76368 -c=1.09827 -d=-0.88828 --color=#FFFFFF-#000000:1 --color=#000088:1 --color=#008800 --color=#000000 -s=8000
Go ahead and play with the program and see what you can come up with!
Will I continue with this program? I am not sure yet. As it is a command-line program, it’s getting quite cumbersome. I may be looking around for some better options. We’ll see what happens! No matter what, it will remain where it is as an example (or as a cautionary tale) of how to draw attractor images.