In my last post , I talked about coloring a de Jong attractor based on the number of times each point in the image was generated by the de Jong equations. Of course, there are other ways to do it! Since we have more than one way, we’d better name them so we don’t get confused. We’ll call the first method Frequency Coloring since it’s based on how frequently each point appears. Now let’s talk about Velocity Coloring!
In velocity coloring, we’ll choose a color for each point based on the average distance that point was from the previous point that was calculated. So if a point is far from the previous point, we’ll say it has a high velocity, and if close to the previous point, we’ll say it has a low velocity. Of course, a particular point may be visited many times, and the locations of the previous points can vary widely, so we need to use the average velocity of that point.
To figure this out, keep a running average of the velocity of each point in an array. We already store a count of the number of times each point was visited, so we’ll just need add a total velocity for each point. Then, when it’s time to calculate colors, we can get the average velocity for any point just by dividing the total velocity by the number of time each point was visited.
There are a couple of considerations to keep in mind when doing this. First, won’t that double the amount of memory we are using? Actually, it will triple it! We use a 32-bit integer to keep track of the hit count. But the total velocity is potentially huge, and could easily overflow an integer. So we have to use a 64-bit long integer. In my early testing, I had neglected this, and used a 32-bit integer for the total velocity, and I got some very weird results! The second consideration is that, although we now care about velocity instead of frequency when coloring, we should still use frequency, not velocity, to determine when to stop drawing the image! Frequency is cumulative, and eventually we’ll be able to hit some criterion we set, such as “stop when any point has been visited a certain number of times”. We can’t do that with velocity, as there is no guarantee we’ll ever hit any velocity threshold.
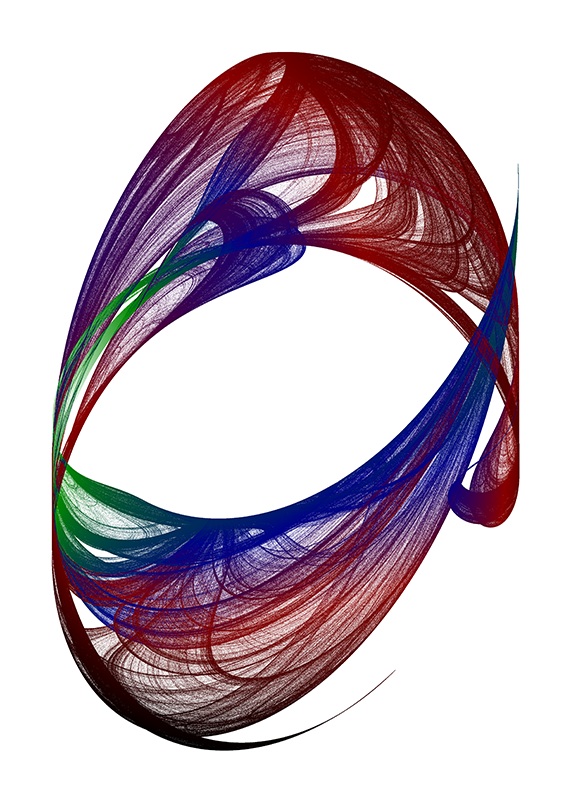
Let’s generate a new image, and color it using frequency:
In this image, there are four color ranges. The darkest points are colored from white to green (wait, what!? That’s right, the point frequency does not have to map to brightness; we can map frequencies to any color we like! Mapping the dakest points to white gives us a white background.) Then there is a green to blue range, a blue to red range, and a red to black range. The specific precentages of each range have been adjusted to give a pleasing (to me, anyway) image.
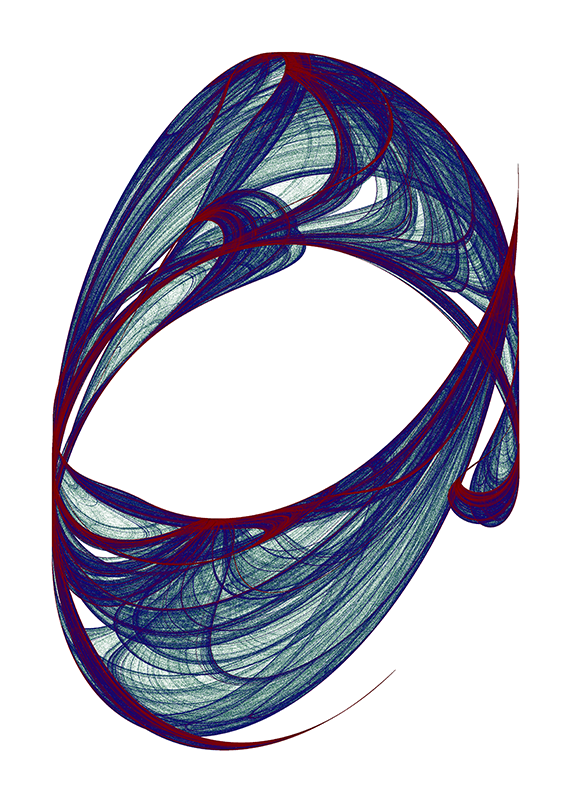
Let’s base the color on velocity instead of frequency, using the same color ranges:
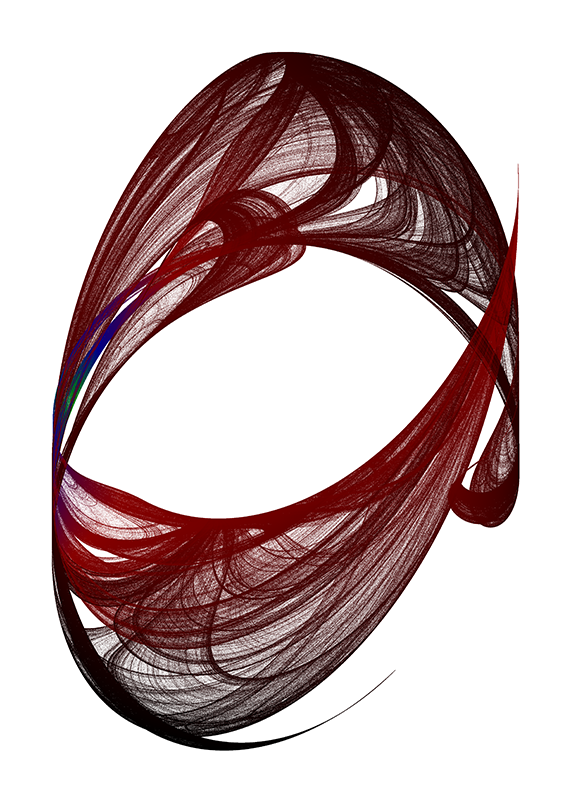
Well, that’s very different! But we lost a lot of the green and blue. That’s because the distribution of velocity values is very different than the distribution of frequency values. So we can adjust the percentages of the various ranges until we get something more interesting to look at:
Velocity isn’t the only alternative to frequency. We could color based on proximity to the center of the image, we could color the points from a sequence of colors in the order the points were drawn, or we could color based on the number of surrounding points. We could color just a range of velocities or frequencies, mapping all the others to the background in order to explore just part of an image.
The possbilities are endless!
P.S. Here are the constants used to generate the de Jong attractor image used in this post:
| Constant | Value |
|---|---|
| a | 2.38815 |
| b | -0.05293 |
| c | 1.48282 |
| d | -2.63213 |